Good SAT Scores by Section
| SAT Score | EBRW Percentile | Math Percentile |
| 800 | 99+ | 99+ |
| 750 | 98 | 96 |
| 700 | 94 | 91 |
| 650 | 86 | 84 |
| 600 | 73 | 75 |
| 550 | 57 | 61 |
| 500 | 40 | 42 |
| 450 | 24 | 27 |
| 400 | 11 | 15 |
| 350 | 3 | 5 |
| 300 | 1- | 1 |
| <250 | 1- | 1- |
Source: CollegeBoard
Find Your SAT Goal Score
Finding what your SAT goal score is important for students to figure out. Finding what your goal score should be will help keep you motivated and give you something to work towards.
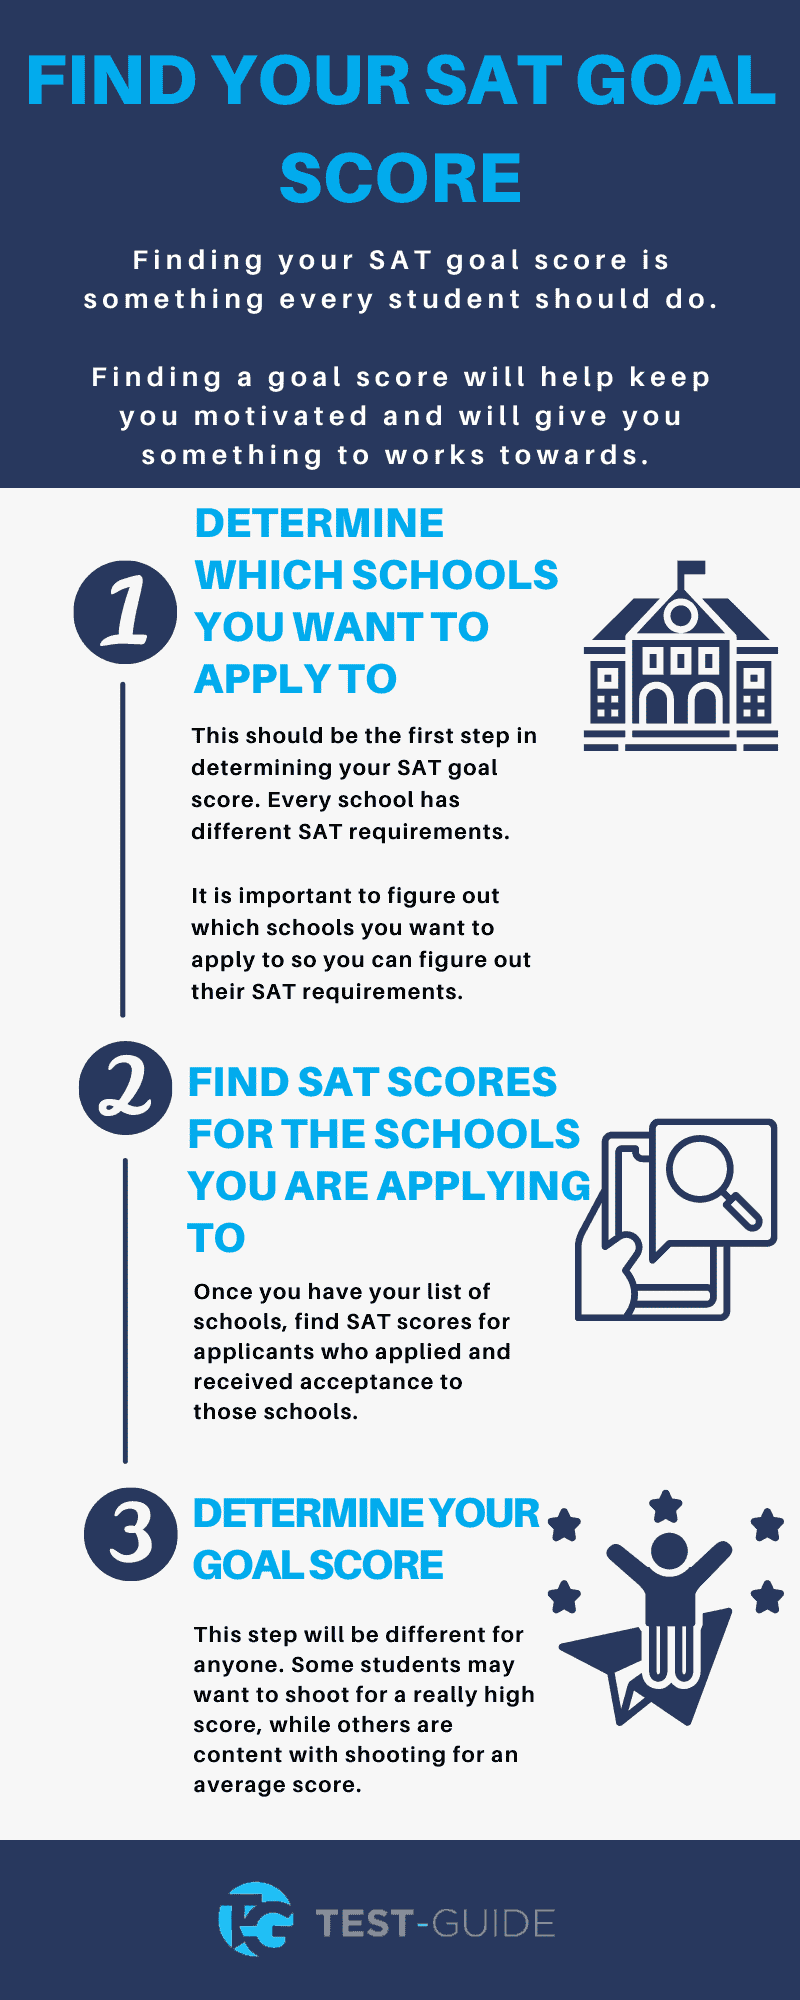
Step 1: Determine Which Schools You Want to Apply To
This should be the first step in determining your SAT goal score. Every school will have different SAT score requirements, so it is important to figure out which schools you want to apply to.
You should choose a variety of schools. Your list should include safety, target, and reach schools. Safety schools are schools you know you can get into. Target schools are schools that you should be able to get into. Reach schools are schools that will be a reach to get into.
Step 2: Find SAT Scores for the Schools You Are Applying To
Once you have your list of schools, find SAT scores for applicants who applied and got into those schools. Luckily for you, we have listed scores for 100 public and 100 private colleges and universities below.
Find those scores and write them down next to each school you are applying to.
Step 3: Determine Your Goal Score
This step will be determined by your personality and your thought process, but it is best to aim for a lofty goal.
Look at the 75th percentile scores for the most competitive school on your list. That should be your goal. If you hit this score, you should be golden for admission to the other schools on your list.
If you miss by a couple of points, you should still be good for the other schools on your list. Make sure to review SAT test dates to ensure you have enough study time to meet your goals.
What Is a Good SAT Score for You?
What may be considered a good SAT score for someone may not be considered a good score for someone else. A lot of what is considered a good score depends on your goals.
If you are someone who is trying to attend Harvard, you will need a top SAT score. If you are someone who just wants to get into college, an average SAT score will probably get the job done.
To make it really simple, a good SAT score is the score that allows you to be competitive when applying to your schools of choice.
We have collected data from the National Center for Education Statistics which outlines SAT scores for public universities. View the table below:
| Institution Name | Percent Admitted | SAT 25th % Score | SAT 75th % Score |
| Arizona State University | 86% | 1120 | 1360 |
| Auburn University | 81% | 1150 | 1320 |
| Boise State University | 77% | 1030 | 1230 |
| California State Polytechnic University-Pomona | 55% | 1010 | 1270 |
| California State University-Fresno | 58% | 940 | 1130 |
| California State University-Fullerton | 53% | 1030 | 1200 |
| California State University-Long Beach | 39% | 1040 | 1250 |
| California State University-Los Angeles | 48% | 890 | 1080 |
| California State University-Northridge | 59% | 910 | 1130 |
| California State University-Sacramento | 82% | 940 | 1140 |
| Clemson University | 51% | 1230 | 1400 |
| Colorado State University-Fort Collins | 81% | 1070 | 1290 |
| East Carolina University | 79% | 1040 | 1190 |
| Florida Atlantic University | 63% | 1080 | 1240 |
| Florida International University | 58% | 1110 | 1280 |
| Florida State University | 36% | 1200 | 1340 |
| George Mason University | 87% | 1110 | 1320 |
| Georgia Institute of Technology | 21% | 1300 | 1510 |
| Georgia Southern University | 54% | 1050 | 1200 |
| Georgia State University | 76% | 1060 | 1250 |
| Grand Valley State University | 83% | 1050 | 1250 |
| Indiana University-Bloomington | 78% | 1150 | 1360 |
| Indiana University-Purdue University-Indianapolis | 81% | 1000 | 1200 |
| Iowa State University | 92% | 1100 | 1340 |
| Kennesaw State University | 75% | 1050 | 1230 |
| Kent State University at Kent | 86% | 1040 | 1230 |
| Louisiana State University and Agricultural & Mechanical College | 75% | 1080 | 1310 |
| Michigan State University | 71% | 1100 | 1320 |
| North Carolina State University at Raleigh | 45% | 1250 | 1420 |
| Ohio State University | 54% | 1250 | 1460 |
| Ohio University | 82% | 1050 | 1260 |
| Oklahoma State University | 70% | 1060 | 1280 |
| Old Dominion University | 89% | 980 | 1180 |
| Oregon State University | 82% | 1080 | 1320 |
| Pennsylvania State University | 76% | 1070 | 1310 |
| Portland State University | 96% | 1000 | 1220 |
| Purdue University | 60% | 1190 | 1440 |
| Rutgers University-New Brunswick | 61% | 1210 | 1430 |
| San Diego State University | 34% | 1110 | 1320 |
| San Francisco State University | 67% | 940 | 1150 |
| San Jose State University | 64% | 1020 | 1260 |
| Stony Brook University | 44% | 1230 | 1440 |
| Texas A & M University | 58% | 1160 | 1390 |
| Texas State University | 81% | 1010 | 1180 |
| Texas Tech University | 69% | 1070 | 1260 |
| The University of Alabama | 83% | 1080 | 1340 |
| The University of Tennessee-Knoxville | 79% | 1150 | 1330 |
| The University of Texas | 32% | 1230 | 1480 |
| The University of Texas at Arlington | 83% | 1040 | 1250 |
| The University of Texas at Dallas | 79% | 1240 | 1460 |
| The University of Texas at San Antonio | 77% | 1030 | 1220 |
| The University of Texas Rio Grande Valley | 80% | 950 | 1130 |
| University at Buffalo | 61% | 1160 | 1340 |
| University of Arizona | 85% | 1110 | 1360 |
| University of Arkansas | 77% | 1120 | 1300 |
| University of California-Berkeley | 16% | 1330 | 1530 |
| University of California-Davis | 39% | 1170 | 1410 |
| University of California-Irvine | 27% | 1170 | 1420 |
| University of California-Los Angeles | 12% | 1300 | 1530 |
| University of California-Riverside | 57% | 1130 | 1330 |
| University of California-San Diego | 31% | 1250 | 1490 |
| University of California-Santa Barbara | 30% | 1230 | 1480 |
| University of Central Florida | 44% | 1170 | 1340 |
| University of Cincinnati | 77% | 1120 | 1350 |
| University of Colorado Boulder | 78% | 1140 | 1360 |
| University of Colorado Denver/Anschutz Medical Campus | 67% | 1000 | 1220 |
| University of Connecticut | 49% | 1200 | 1410 |
| University of Delaware | 71% | 1160 | 1350 |
| University of Florida | 37% | 1310 | 1470 |
| University of Georgia | 45% | 1240 | 1420 |
| University of Houston | 65% | 1140 | 1310 |
| University of Illinois Chicago | 73% | 1030 | 1260 |
| University of Illinois Urbana-Champaign | 59% | 1210 | 1470 |
| University of Iowa | 83% | 1130 | 1340 |
| University of Kentucky | 96% | 1070 | 1320 |
| University of Maryland-College Park | 44% | 1280 | 1470 |
| University of Massachusetts-Amherst | 64% | 1190 | 1390 |
| University of Michigan-Ann Arbor | 23% | 1340 | 1530 |
| University of Minnesota-Twin Cities | 57% | 1260 | 1480 |
| University of Missouri-Columbia | 81% | 1120 | 1340 |
| University of Nebraska-Lincoln | 78% | 1120 | 1360 |
| University of Nevada-Las Vegas | 81% | 1030 | 1250 |
| University of North Carolina at Chapel Hill | 23% | 1310 | 1500 |
| University of North Carolina at Charlotte | 65% | 1120 | 1290 |
| University of North Texas | 74% | 1060 | 1250 |
| University of Oklahoma-Norman Campus | 80% | 1110 | 1310 |
| University of Pittsburgh-Pittsburgh Campus | 57% | 1260 | 1440 |
| University of South Carolina-Columbia | 69% | 1180 | 1370 |
| University of South Florida | 48% | 1170 | 1330 |
| University of Utah | 62% | 1143 | 1380 |
| University of Virginia | 24% | 1340 | 1520 |
| University of Washington-Seattle Campus | 52% | 1220 | 1470 |
| University of Wisconsin-Madison | 54% | 1300 | 1480 |
| Utah State University | 91% | 1050 | 1310 |
| Virginia Commonwealth University | 87% | 1070 | 1260 |
| Virginia Polytechnic Institute and State University | 70% | 1180 | 1390 |
| Washington State University | 76% | 1020 | 1230 |
| Wayne State University | 73% | 1010 | 1230 |
| West Virginia University | 84% | 1030 | 1230 |
Improving Your SAT Score
If you are looking for various ways to increase your SAT score, check out some of the tips listed below. One surefire way to increase your score is by using practice exams.
Become Familiar With the SAT
In other words, practice, practice, practice! Become comfortable with the types of questions they are going to ask as well as completing as many questions as you can under the time restraint.
There are many resources, including test prep classes, and tutors, that can help you improve your score, so take advantage of them!
Use our free SAT practice questions to become more familiar with the SAT.
Re-Take the Test
You have as many chances to take and re-take the test as you want. Many students gradually increase their score as the number of attempts increase and as they become more used to the test.
If you don’t have the time to re-take the test and your score puts you at risk for acceptance into your top university, consider adding several “safety” schools.
You Can Super-Score Your Score
Many universities will consider superscoring all your SAT’s which essentially means picking and choosing the highest scores from various attempts at the SAT.
So, if your second attempt had your highest math score and your first attempt had your highest reading/writing score, you can combine them. All the more reason why taking the test multiple times is beneficial.
Use Your Time to the Best of Your Ability
There will be trick questions and there will be questions you have absolutely no clue what the answer is. The great thing about the SAT? Wrong answers do not count against you! If you don’t know the answer, make an educated guess and move on.
It does not serve in your best interest to waste 10 minutes on a question and then not be able to answer all the other questions in that section.
One great way to use your time better is to enroll in a SAT prep course. There are many great providers out there, make sure to find one that fits your specific needs.
Go Into the Test Fully Prepared and Well-Rested
You are given short breaks in between sections- utilize them! Bring a snack, quickly decompress, and then get ready to dive back in. When you are well-rested and feel great before going into the exam, chances are that you will score better.
This applies to your mentality too. If you go in unsure of yourself with poor confidence, chances are you will doubt yourself and score lower.