One way to measure is by looking at the average SAT scores by state. According to the data we collected, midwestern students tended to score higher on their SAT than students in other regions.
Except for their two outlier states, Illinois and Wyoming, their college admission rate is between the 60-80% range. Comparing both college admission and average SAT scores by state gives a student better insight to the schools they’re applying to.
Both the West and South regions had scattered results. In the South, Tennessee had the highest SAT average (1220), while North Carolina had the highest college admission rate (84.4%). Utah, in the West, had the highest SAT average score (1238). Although it didn’t have the highest college admission—it was 2.61 points away from Washington’s winning percentage of 80.24%.
The Northeastern states showed the smallest difference between average college admission rate and SAT score. In the region, no state was above a 77% college admission rate or 1185 average SAT score. Rhode Island ranked lowest for both college admission rate (57.83%) and SAT score (1011). Massachusetts had the best SAT average (1184), meanwhile, New Jersey had the best college admission rate (76.21%).
The Smartest U.S. States, According to Test Scores
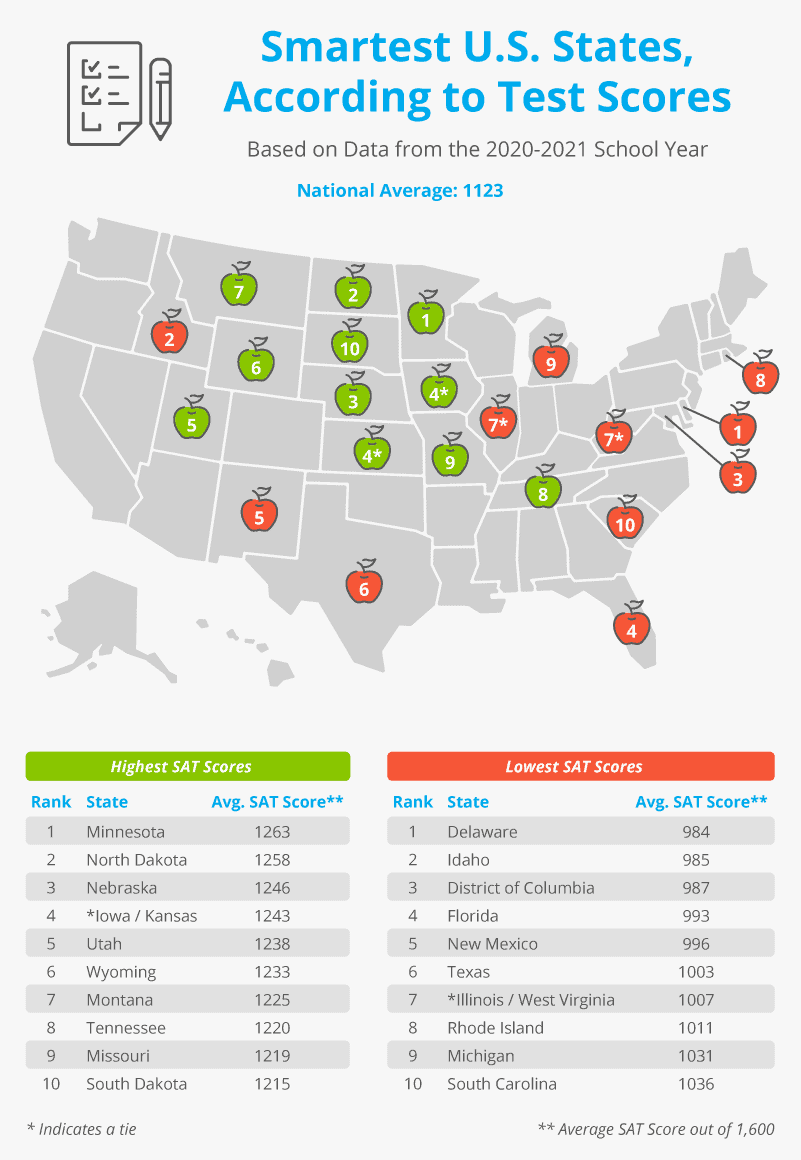
Out of all of the states, Minnesota came out on top with the highest average SAT score of 1263, which was 140 points above the national average. North Dakota earned an average score of 1258, while Nebraska trailed closely behind with a 1246.
Iowa and Kansas found themselves tied for fourth place for highest SAT scores, while Illinois and West Virginia were tied for seventh place for the lowest. Delaware is the lowest scoring state at 984, 134 points below the national average.
In some states, taking the SAT is a requirement, meaning their participation rate is likely high. Delaware is a state that requires its students to take the SAT as a graduation requirement and they scored the lowest.
A state making the SAT a requirement for college admissions doesn’t automatically give them a low average. For example, the test isn’t required in DC, which scored 987 on average. Although it isn’t a must for students, it is offered for free to all juniors and seniors.
Why Do The State Averages Matter?
Instead of setting your state’s average SAT score as your goal, let it act as a solid base to compare yourself to. Give yourself a competitive edge for college admission, especially if a lot of the other students from the same state are applying to the same universities.
Though it is a good comparison point for students to have, remember scores aren’t the only important factor to college admissions.
Though SAT scores play a major part in the process, other factors like GPA, grades, extracurricular activities, and recommendations are considered.
U.S. States With the Highest and Lowest College Admission Rates
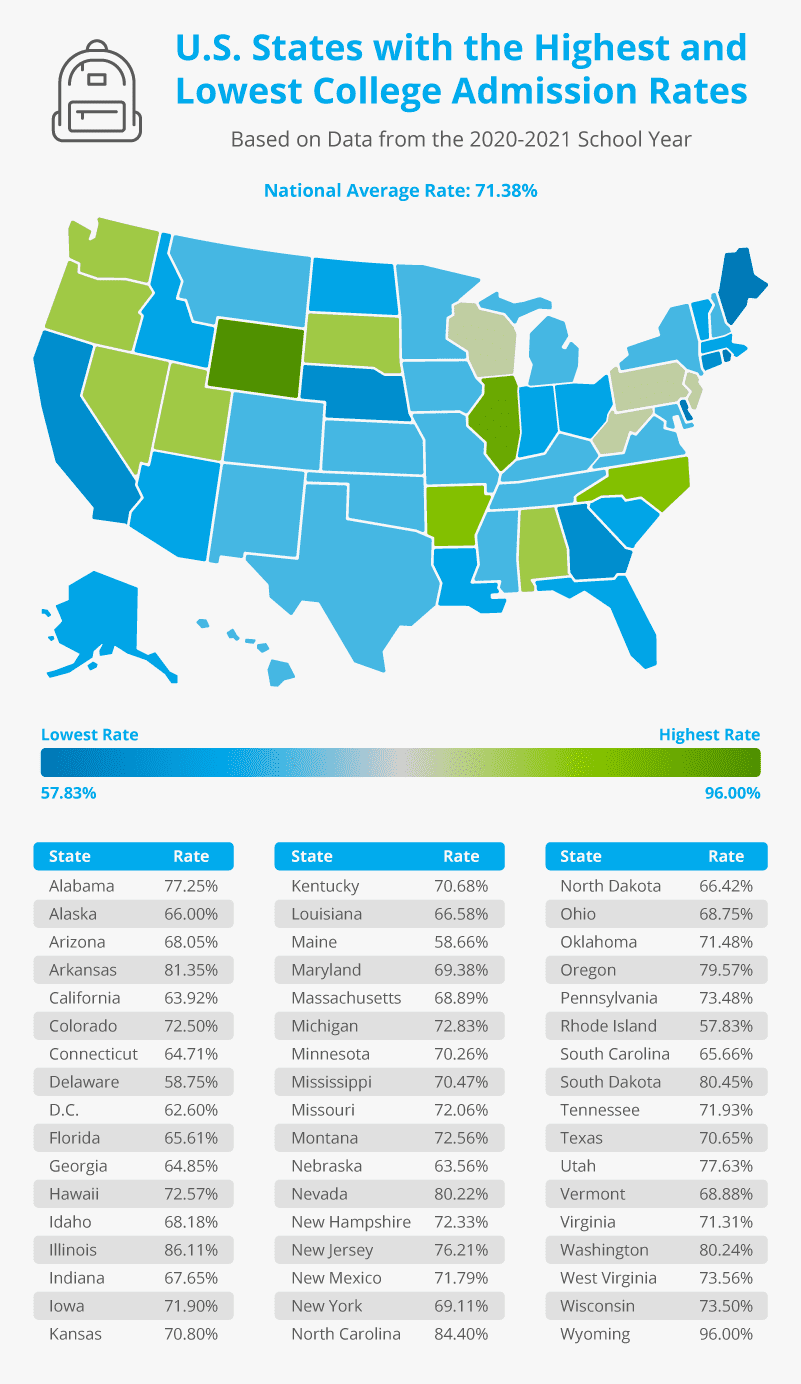
The states with the highest college admission rate are Wyoming (96%), Illinois (86.1%), and North Carolina (84.40%). The lowest scoring states are Rhode Island (57.83%) Maine (58.66), and Delaware (58.75).
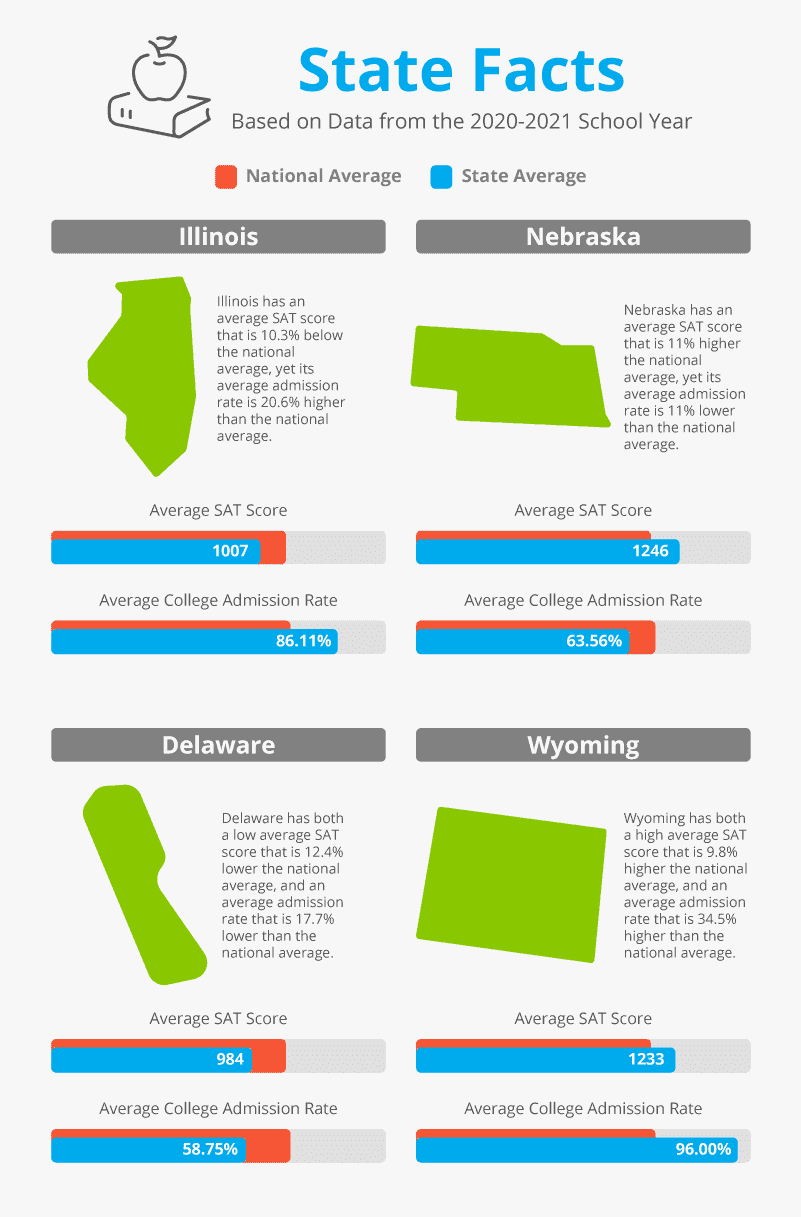
State Facts
Full Dataset
Did your state not make the lists above? See how it fared with our full dataset comparing test scores to college admission rates from the 2020-2021 school year for all 50 U.S. states and the District of Columbia.
| State | Average ACT Score (Out of 36) | Average SAT score (out of 1600) | College Admission Rate |
| Alabama | 18.7 | 1159 | 77.25% |
| Alaska | 20.6 | 1119 | 66.00% |
| Arizona | 19.8 | 1181 | 68.05% |
| Arkansas | 19 | 1194 | 81.35% |
| California | 26.1 | 1057 | 63.92% |
| Colorado | 23.6 | 1072 | 72.50% |
| Connecticut | 27.2 | 1072 | 64.71% |
| Delaware | 25.7 | 984 | 58.75% |
| District of Columbia | 25.6 | 987 | 62.60% |
| Florida | 20.4 | 993 | 65.61% |
| Georgia | 22.6 | 1086 | 64.85% |
| Hawaii | 18.2 | 1144 | 72.57% |
| Idaho | 23 | 985 | 68.18% |
| Illinois | 25.2 | 1007 | 86.11% |
| Indiana | 23.1 | 1095 | 67.65% |
| Iowa | 21.5 | 1243 | 71.90% |
| Kansas | 19.9 | 1243 | 70.80% |
| Kentucky | 19.2 | 1219 | 70.68% |
| Louisiana | 18.4 | 1188 | 66.58% |
| Maine | 25.6 | 1099 | 58.66% |
| Maryland | 25.5 | 1073 | 69.38% |
| Massachusetts | 27.6 | 1184 | 68.89% |
| Michigan | 25.1 | 1031 | 72.83% |
| Minnesota | 21.6 | 1263 | 70.26% |
| Mississippi | 18.1 | 1202 | 70.47% |
| Missouri | 20.6 | 1219 | 72.06% |
| Montana | 20.4 | 1225 | 72.56% |
| Nebraska | 20 | 1246 | 63.56% |
| Nevada | 17.8 | 1195 | 80.22% |
| New Hampshire | 26.6 | 1065 | 72.33% |
| New Jersey | 25.1 | 1125 | 76.21% |
| New Mexico | 20.7 | 996 | 71.79% |
| New York | 26.3 | 1057 | 69.11% |
| North Carolina | 18.9 | 1150 | 84.40% |
| North Dakota | 19.6 | 1258 | 66.42% |
| Ohio | 19.6 | 1048 | 68.75% |
| Oklahoma | 19.7 | 1042 | 71.48% |
| Oregon | 20.6 | 1119 | 79.57% |
| Pennsylvania | 25 | 1123 | 73.48% |
| Rhode Island | 25.8 | 1011 | 57.83% |
| South Carolina | 18.6 | 1036 | 65.66% |
| South Dakota | 21.6 | 1215 | 80.45% |
| Tennessee | 19.1 | 1220 | 71.93% |
| Texas | 20.1 | 1003 | 70.65% |
| Utah | 20.6 | 1238 | 77.63% |
| Vermont | 24.7 | 1124 | 68.88% |
| Virginia | 25.5 | 1151 | 71.31% |
| Washington | 23.6 | 1072 | 80.24% |
| West Virginia | 20.8 | 1007 | 73.56% |
| Wisconsin | 20 | 1215 | 73.50% |
| Wyoming | 19.8 | 1233 | 96.00% |
| National Average | 22 | 1123 | 71.38% |