ACT Score Ranges – Biggest 50 Public Universities
If you are curious about the ACT scores range for various schools around the country, review the table below.
We have included the 25th and 75th percentile ACT scores for the 50 biggest universities in the country.
| Institution name | Enrollment | ACT Composite 25th Percentile | ACT Composite 75th Percentile |
| Texas A & M University-College Station | 67,929 | 25 | 30 |
| University of Central Florida | 66,059 | 24 | 29 |
| Ohio State University-Main Campus | 59,837 | 27 | 31 |
| Florida International University | 56,718 | 22 | 27 |
| University of Florida | 52,669 | 28 | 32 |
| University of Minnesota-Twin Cities | 51,848 | 26 | 31 |
| The University of Texas at Austin | 51,525 | 26 | 33 |
| Arizona State University-Tempe | 51,164 | 22 | 29 |
| Michigan State University | 50,019 | 23 | 28 |
| University of Illinois at Urbana-Champaign | 48,216 | 26 | 32 |
| Pennsylvania State University-Main Campus | 47,119 | 25 | 30 |
| The University of Texas at Arlington | 46,497 | 20 | 27 |
| University of Washington-Seattle Campus | 46,166 | 27 | 32 |
| University of Michigan-Ann Arbor | 46,002 | 30 | 33 |
| University of Houston | 45,364 | 23 | 27 |
| University of California-Los Angeles | 44,027 | 29 | 34 |
| Indiana University-Bloomington | 43,710 | 25 | 31 |
| University of South Florida-Main Campus | 43,540 | 24 | 29 |
| University of Wisconsin-Madison | 42,977 | 27 | 31 |
| Purdue University-Main Campus | 42,699 | 25 | 31 |
| University of California-Berkeley | 41,891 | 30 | 34 |
| Florida State University | 41,362 | 26 | 30 |
| California State University-Northridge | 41,319 | 17 | 22 |
| California State University-Fullerton | 40,905 | 19 | 24 |
| University of Maryland-College Park | 40,521 | 29 | 33 |
| Texas State University | 38,666 | 20 | 26 |
| The University of Alabama | 38,563 | 23 | 32 |
| University of North Texas | 38,276 | 21 | 27 |
| California State University-Long Beach | 37,622 | 20 | 26 |
| University of Georgia | 37,606 | 26 | 31 |
| University of California-Davis | 37,380 | 25 | 32 |
| University of Cincinnati-Main Campus | 37,155 | 23 | 28 |
| Texas Tech University | 36,996 | 22 | 27 |
| Iowa State University | 36,158 | 22 | 28 |
| George Mason University | 35,984 | 24 | 30 |
| Kennesaw State University | 35,846 | 21 | 26 |
| San Jose State University | 35,835 | 19 | 26 |
| University of California-San Diego | 35,772 | 27 | 33 |
| University of Colorado Boulder | 35,338 | 25 | 30 |
| University of California-Irvine | 35,242 | 25 | 32 |
| San Diego State University | 35,158 | 23 | 28 |
| University of South Carolina-Columbia | 34,731 | 25 | 30 |
| Virginia Polytechnic Institute and State University | 34,440 | 25 | 30 |
| North Carolina State University at Raleigh | 34,432 | 26 | 31 |
| Colorado State University-Fort Collins | 33,083 | 22 | 28 |
| Georgia State University | 32,816 | 19 | 26 |
| University of Utah | 32,800 | 22 | 29 |
| University of Iowa | 32,166 | 23 | 28 |
| California State University-Sacramento | 31,255 | 17 | 23 |
| Oregon State University | 30,896 | 22 | 28 |
| Average ACT Score of Top 100 Public Universities | 22.9 | 28.4 |
Find Your ACT Goal Score
Finding your ACT goal score is something every student preparing for the ACT should do. Finding a goal score will help keep you motivated and will give you something to works towards.
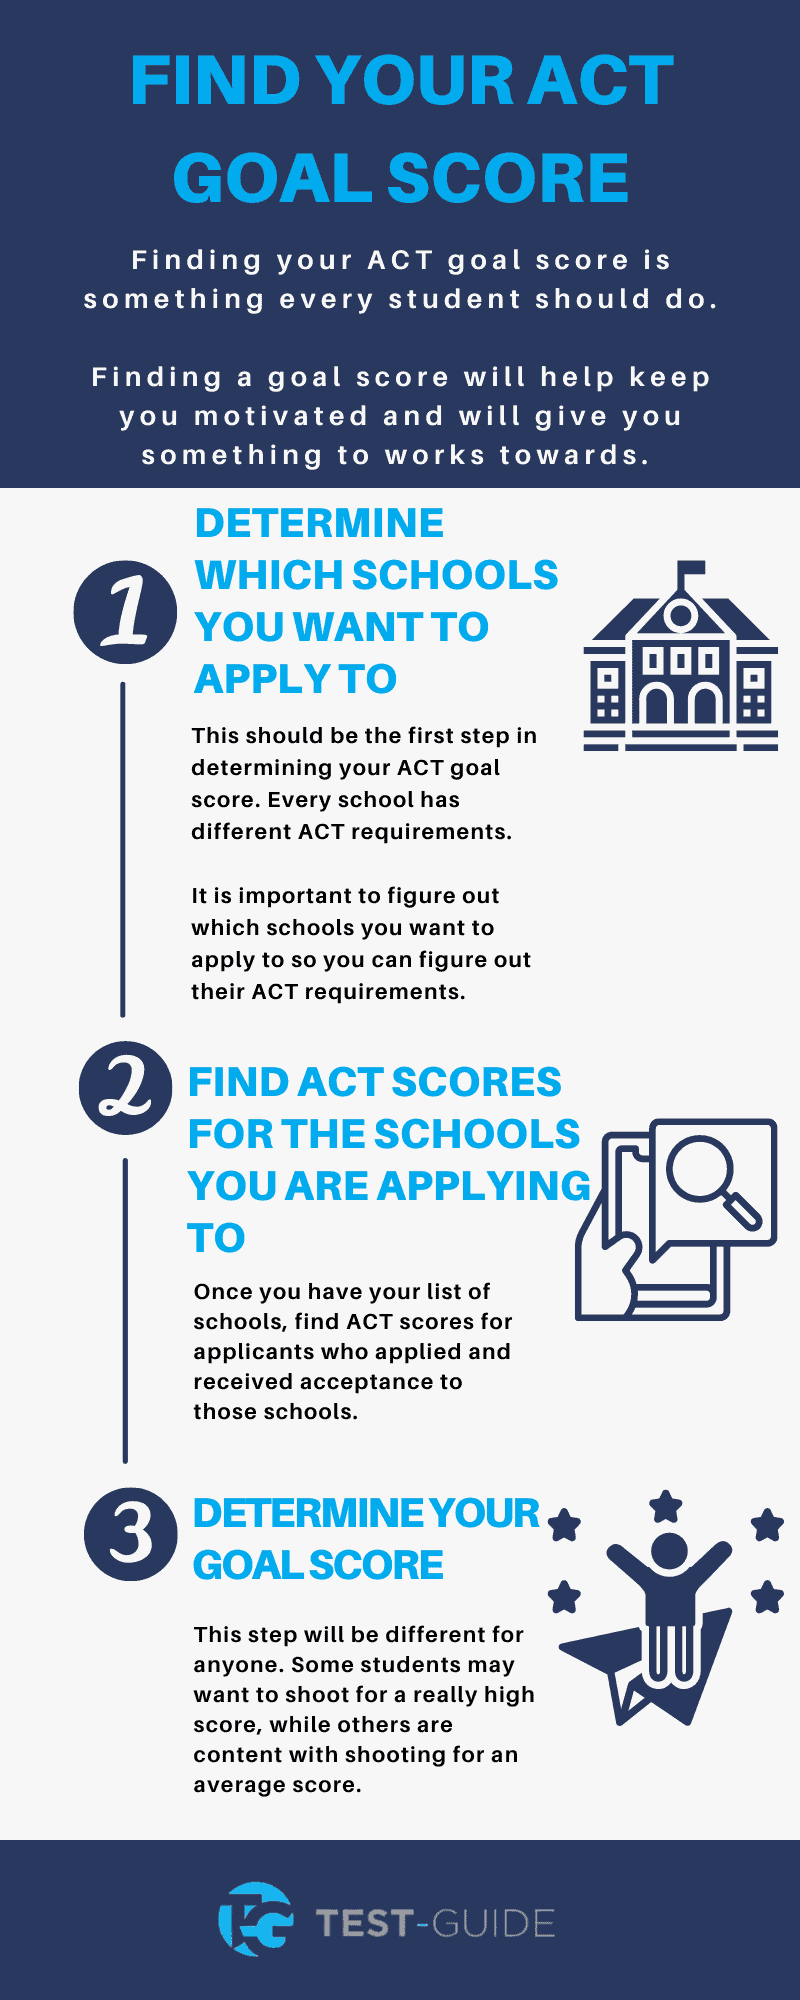
Step 1: Determine Which Schools You Want to Apply To
This should be the first step in determining your ACT goal score. Every school has different ACT requirements. It is important to figure out which schools you want to apply to so you can figure out their ACT requirements.
Try and pick schools in different categories. For example, do not pick all Ivy League schools. Pick some target, reach, and safety schools to put on your list.
Step 2: Find ACT Scores for the Schools You Are Applying To
Once you have your list of schools, find ACT scores for applicants who applied and received acceptance to those schools.
Find those scores and write them down next to each of the schools on your application list.
Step 3: Determine Your Goal Score
This step will be different for everyone. Some students may want to shoot for a high score, while others are content with shooting for an average score.
Look at the 75th percentile scores for the most competitive school on your list. This score should be your goal. If you get this score, you should be able to gain admission into every other school on your list (in theory).
If you miss by a couple of points, you should be fine for some of the other schools on your list.
Improving Your ACT Score
If you are looking to improve you ACT score, review some of the tips listed below. Remember, improving your score is a process, and a lot of students end up taking the exam multiple times.
Familiarize Yourself With the ACT
It is true: practice makes perfect. The more practice questions you answer, the more comfortable you will become with the format and feel of the ACT.
Take our ACT-style practice exams to help familiarize yourself. You will get a good feel for the types of questions and concepts you need to know.
In addition, you will also figure out which subjects give you the most trouble. You can then focus on these subjects when studying to help save time.
Re-Take the Exam
Retaking the exam is very common. Plenty of students end up taking the ACT more than once. Students will have a better idea of what to expect the second time around.
In general, students will improve their scores the second time around – whether it is because they studied more or were more comfortable.
Tip: Review ACT test dates before scheduling your second exam. Make sure you have plenty of time to study for the second exam.
Superscore Your Score
Superscoring your score means taking the best score from every section of every ACT you have taken and creating a new composite score.
Say you have taken the ACT 2 times. The first time you got a 29 in math and the second time you got a 24 in math. Assume every other section score was better the second time around, except math.
You could take the 29 from the first exam and combine that with the section scores from the second ACT.
The ACT will automatically send superscores to your colleges – it may work for certain schools or certain programs within colleges or universities. It is worth asking someone at that school if they take superscores.
Find What Works Best for You
Students learn in many ways. Some students learn best in a classroom setting while others learn best by self-studying. Find what works for you and stick with it.