Smartest States in the US
Curious which states are the smartest? To determine the smartest states in the U.S., we looked at a few key factors including IQ scores, ACT & SAT scores, high school graduation rates, bachelor degree statistics.
We also looked to see if risky behaviors, TV viewing behaviors, various beliefs, and other interesting behaviors were correlated to intelligence.
Review our findings below.
Smartest State Rankings
Find out which states are the smartest based on our research study. We ranked the smartest states using a combination of these criteria:
- IQ Scores
- ACT & SAT Scores
- High School Graduation Rates
- Percent Holding a Bachelor Degree
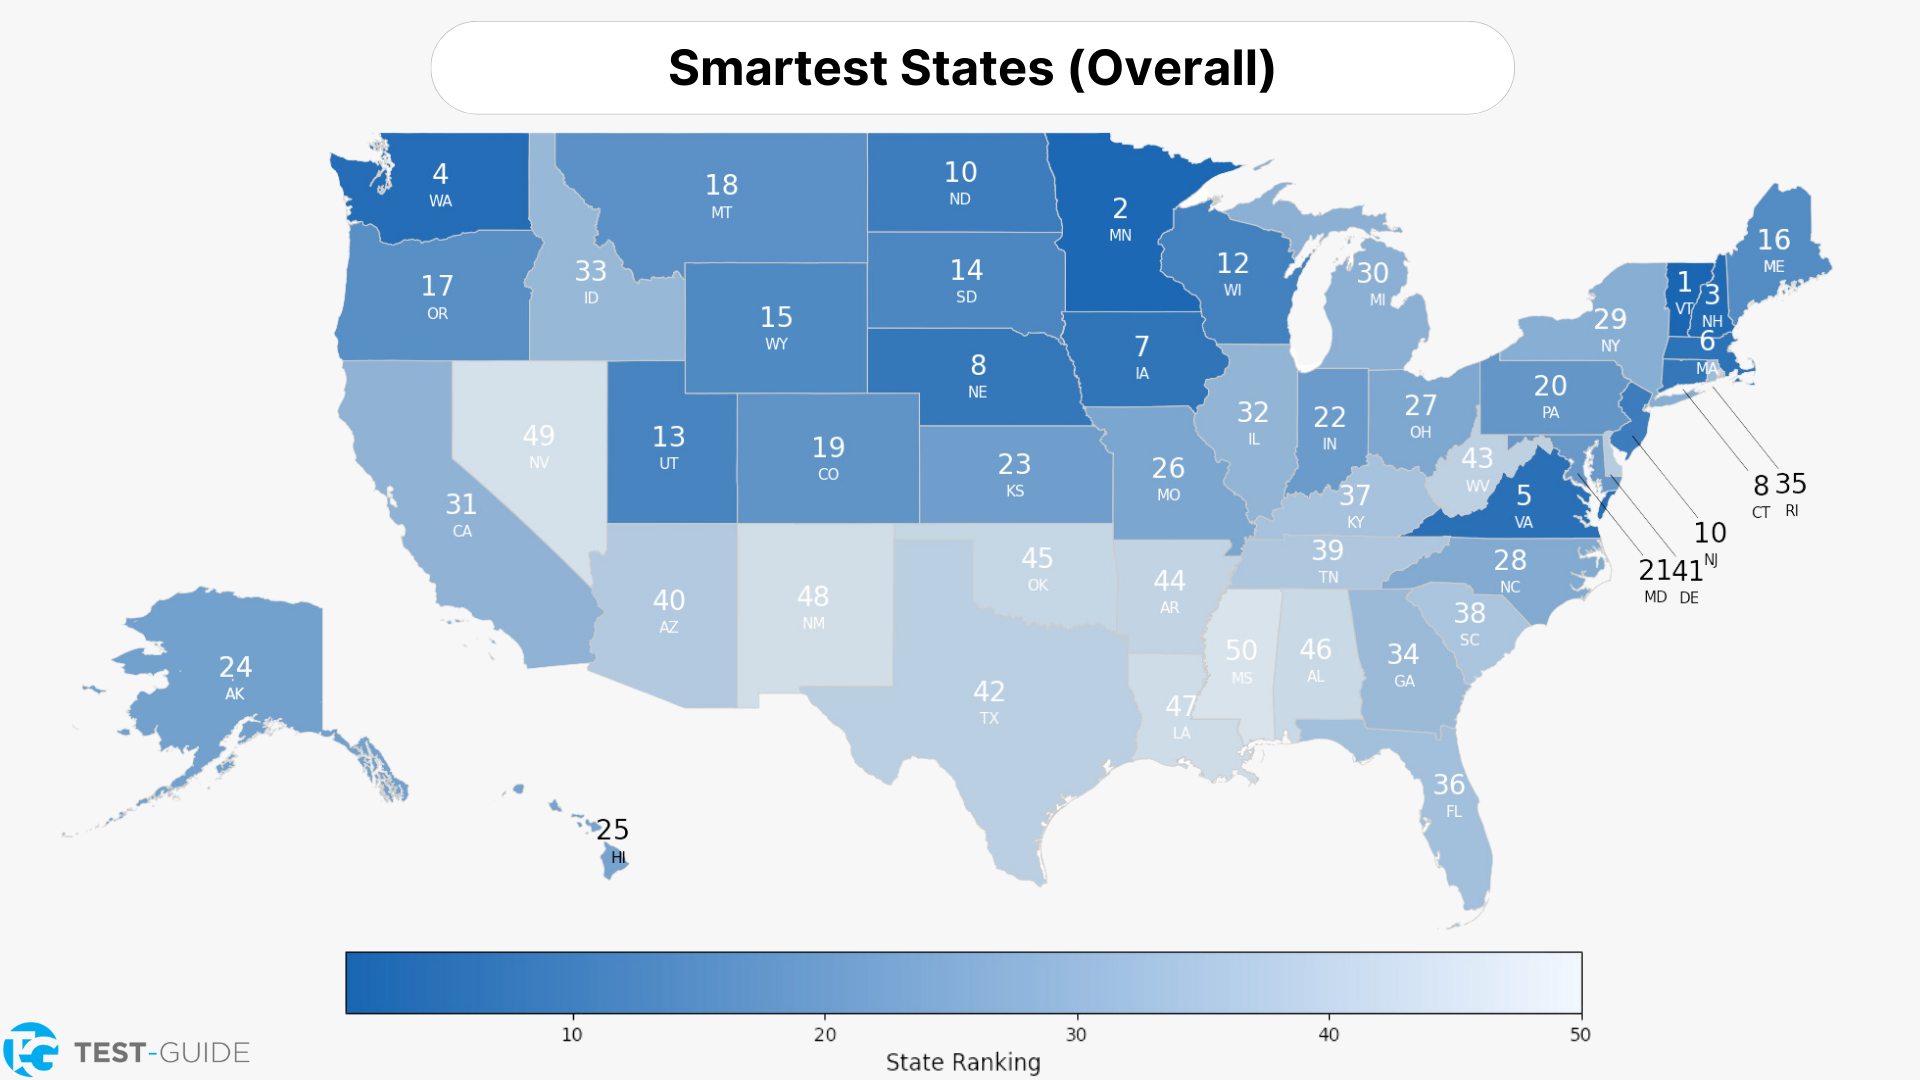
Top 10 Smartest States
- Vermont
- Minnesota
- New Hampshire
- Washington
- Virginia
- Massachusetts
- Iowa
- Connecticut (Tie)
- Nebraska (Tie)
- New Jersey
Bottom 10 Smartest States
- Mississippi
- Nevada
- New Mexico
- Louisiana
- Alabama
- Oklahoma
- Arkansas
- West Virginia
- Texas
- Delaware
| State | Smart Rank | Average IQ Score | Converted Average SAT Score | HS Graduation Rate | % Holding a Bachelor Degree |
|---|---|---|---|---|---|
| Vermont | 1 | 102.2 | 1095 | 93.50% | 14.20% |
| Minnesota | 2 | 102.9 | 1080 | 93.40% | 13.40% |
| New Hampshire | 3 | 103.2 | 1050 | 93.30% | 14.60% |
| Washington | 4 | 101.5 | 1096 | 91.70% | 13.00% |
| Virginia | 5 | 101.2 | 1124 | 90.30% | 13.90% |
| Massachusetts | 6 | 103.1 | 1029 | 91.10% | 19.30% |
| Iowa | 7 | 101.1 | 1092 | 92.50% | 11.50% |
| Connecticut | 8 | 101.2 | 1025 | 90.90% | 18.20% |
| Nebraska | 8 | 101.2 | 1022 | 91.60% | 14.90% |
| New Jersey | 10 | 101 | 1079 | 90.30% | 19.40% |
| North Dakota | 10 | 101.7 | 1016 | 93.10% | 13.20% |
| Wisconsin | 12 | 101.2 | 1022 | 92.60% | 13.30% |
| Utah | 13 | 101.5 | 1037 | 93.00% | 7.60% |
| South Dakota | 14 | 100.7 | 1095 | 92.20% | 10.30% |
| Wyoming | 15 | 101.7 | 1016 | 93.60% | 10.00% |
| Maine | 16 | 100.9 | 1081 | 93.20% | 9.30% |
| Oregon | 17 | 100.3 | 1143 | 91.10% | 10.00% |
| Montana | 18 | 101.1 | 1019 | 94.00% | 12.50% |
| Colorado | 19 | 101.1 | 1021 | 92.10% | 14.10% |
| Pennsylvania | 20 | 100.2 | 1091 | 91.00% | 13.80% |
| Maryland | 21 | 100 | 1075 | 90.60% | 16.90% |
| Indiana | 22 | 100.6 | 1073 | 89.30% | 11.80% |
| Kansas | 23 | 100.5 | 1037 | 91.40% | 12.50% |
| Alaska | 24 | 99.4 | 1110 | 93.10% | 3.50% |
| Hawaii | 25 | 99.2 | 1063 | 92.50% | 13.80% |
| Missouri | 26 | 99.5 | 1048 | 90.60% | 12.80% |
| Ohio | 27 | 100 | 1022 | 90.80% | 12.40% |
| North Carolina | 28 | 99.5 | 1063 | 88.50% | 12.40% |
| New York | 29 | 98.4 | 1067 | 87.20% | 19.00% |
| Michigan | 30 | 99.6 | 1000 | 91.30% | 12.20% |
| California | 31 | 97.1 | 1115 | 83.90% | 12.20% |
| Illinois | 32 | 99.4 | 981 | 89.70% | 16.30% |
| Idaho | 33 | 100.5 | 968 | 91.30% | 6.70% |
| Georgia | 34 | 98.1 | 1079 | 87.90% | 11.00% |
| Rhode Island | 35 | 99.4 | 971 | 89.20% | 15.40% |
| Florida | 36 | 98.8 | 997 | 88.50% | 11.50% |
| Kentucky | 37 | 98.8 | 994 | 87.20% | 11.40% |
| South Carolina | 38 | 97.8 | 1018 | 88.30% | 11.40% |
| Tennessee | 39 | 98.3 | 994 | 88.20% | 11.90% |
| Arizona | 40 | 98.3 | 986 | 87.90% | 10.50% |
| Delaware | 41 | 98.7 | 968 | 90.60% | 9.40% |
| Texas | 42 | 97.4 | 1018 | 84.40% | 10.90% |
| West Virginia | 43 | 97.2 | 999 | 87.60% | 9.70% |
| Arkansas | 44 | 97.1 | 1002 | 87.20% | 9.70% |
| Oklahoma | 45 | 98.2 | 966 | 88.60% | 7.90% |
| Alabama | 46 | 96.4 | 970 | 86.90% | 9.10% |
| Louisiana | 47 | 95.2 | 974 | 85.90% | 8.60% |
| New Mexico | 48 | 95 | 976 | 86.50% | 8.20% |
| Nevada | 49 | 96.6 | 942 | 86.90% | 8.20% |
| Mississippi | 50 | 95.8 | 962 | 85.30% | 8.60% |
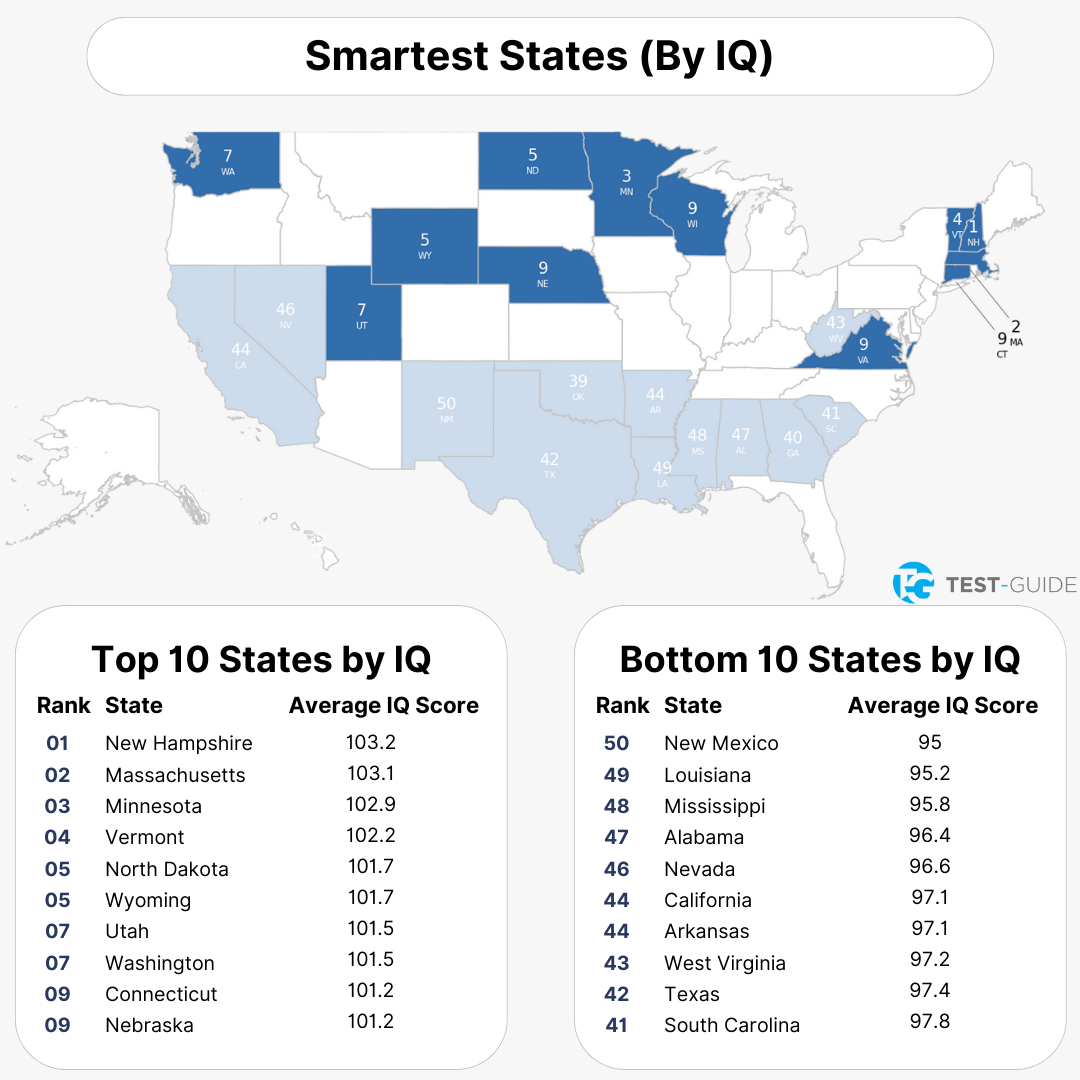
Smartest States by IQ
We used IQ as a ranking factor when calculating the smartest states.
Review the top 10 and bottom 10 states in terms of IQ below.
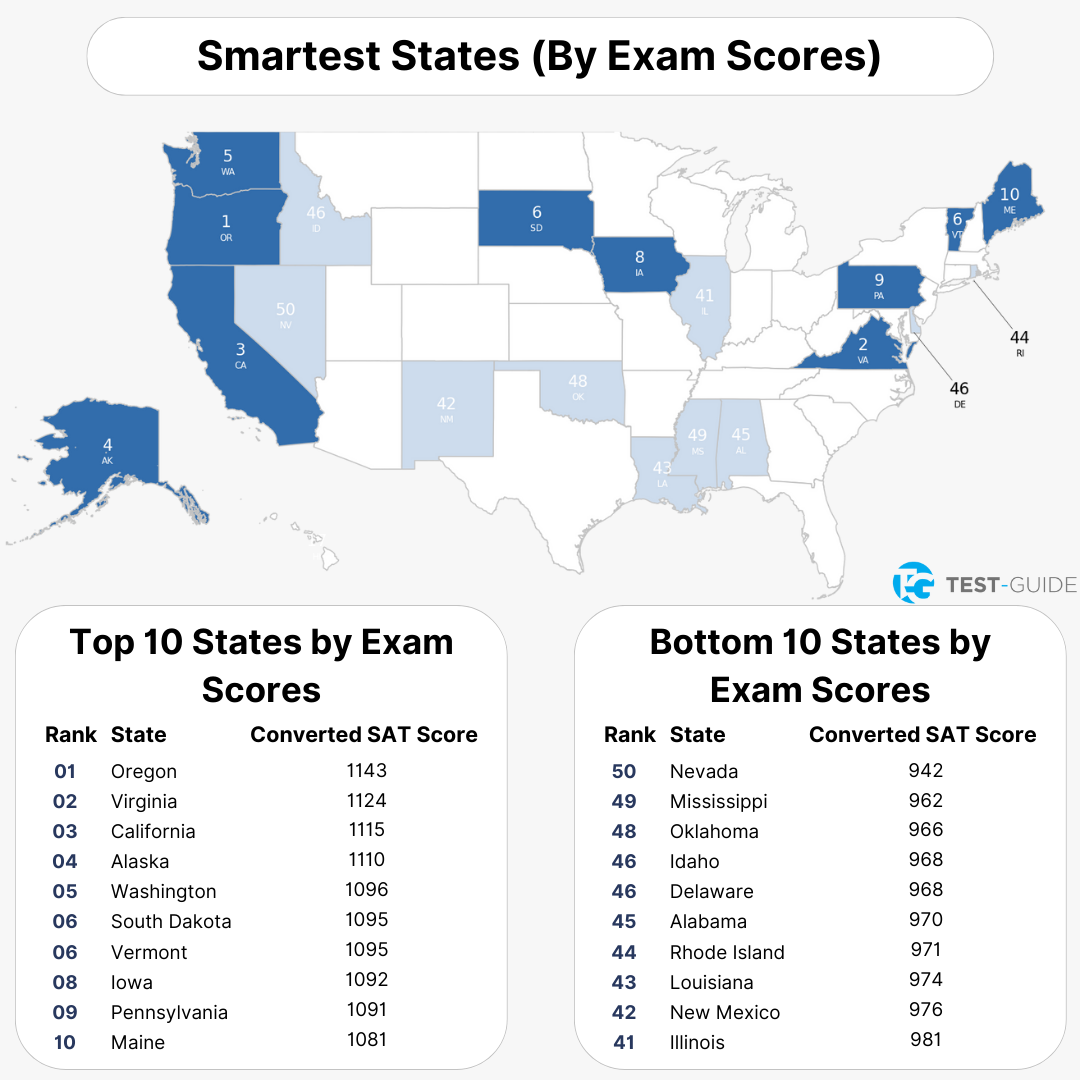
Smartest States by ACT and SAT Scores
We used ACT and SAT scores as a ranking factor when calculating the smartest states. To compare “apples to apples” we converted ACT scores to SAT scores for states that did not have enough SAT score data.
Review the top 10 and bottom 10 states in terms of ACT and SAT scores below.
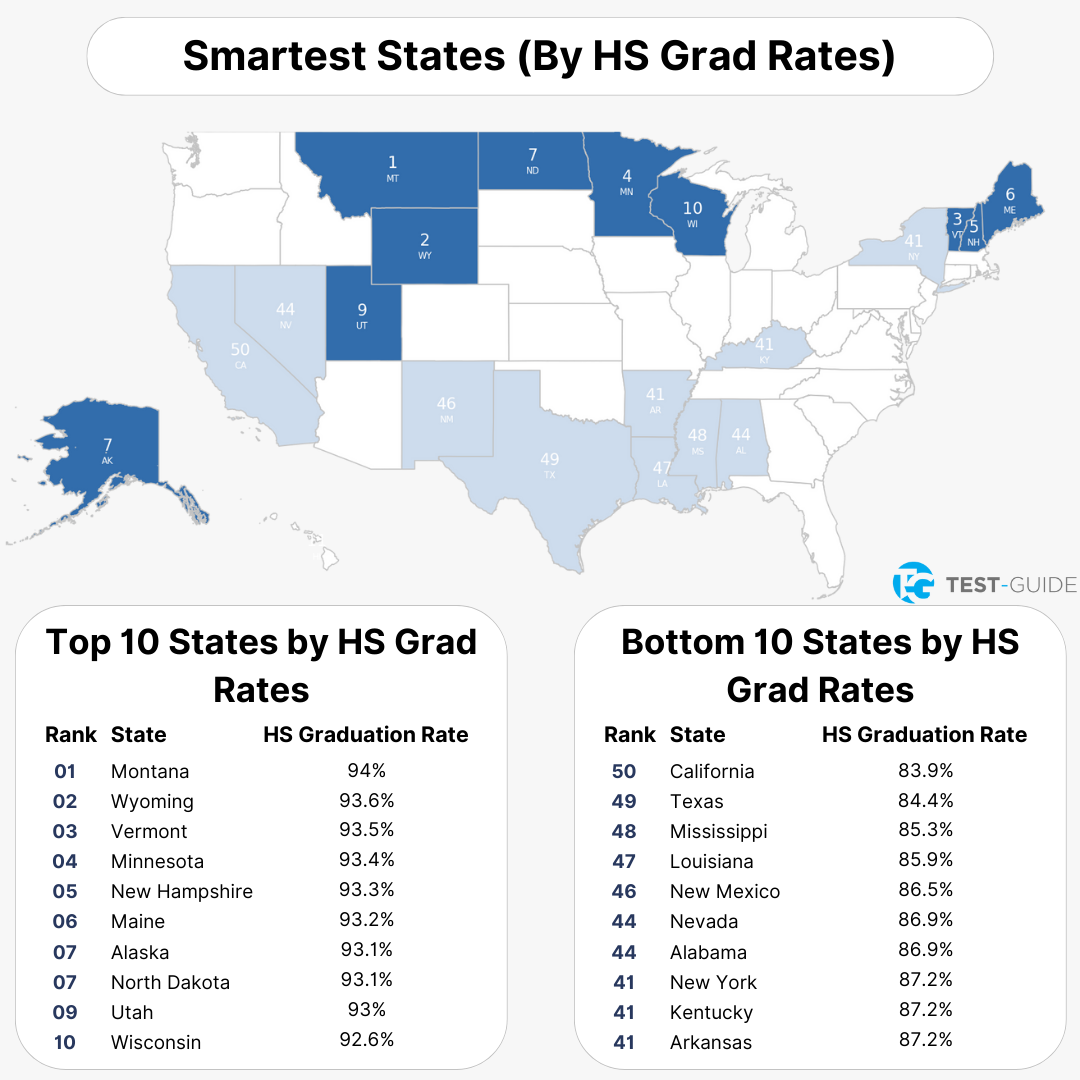
Smartest States by High School Graduation Rates
We used high school graduation rates as a ranking factor when calculating the smartest states.
Review the top 10 and bottom 10 states in terms of high school graduation rates below.
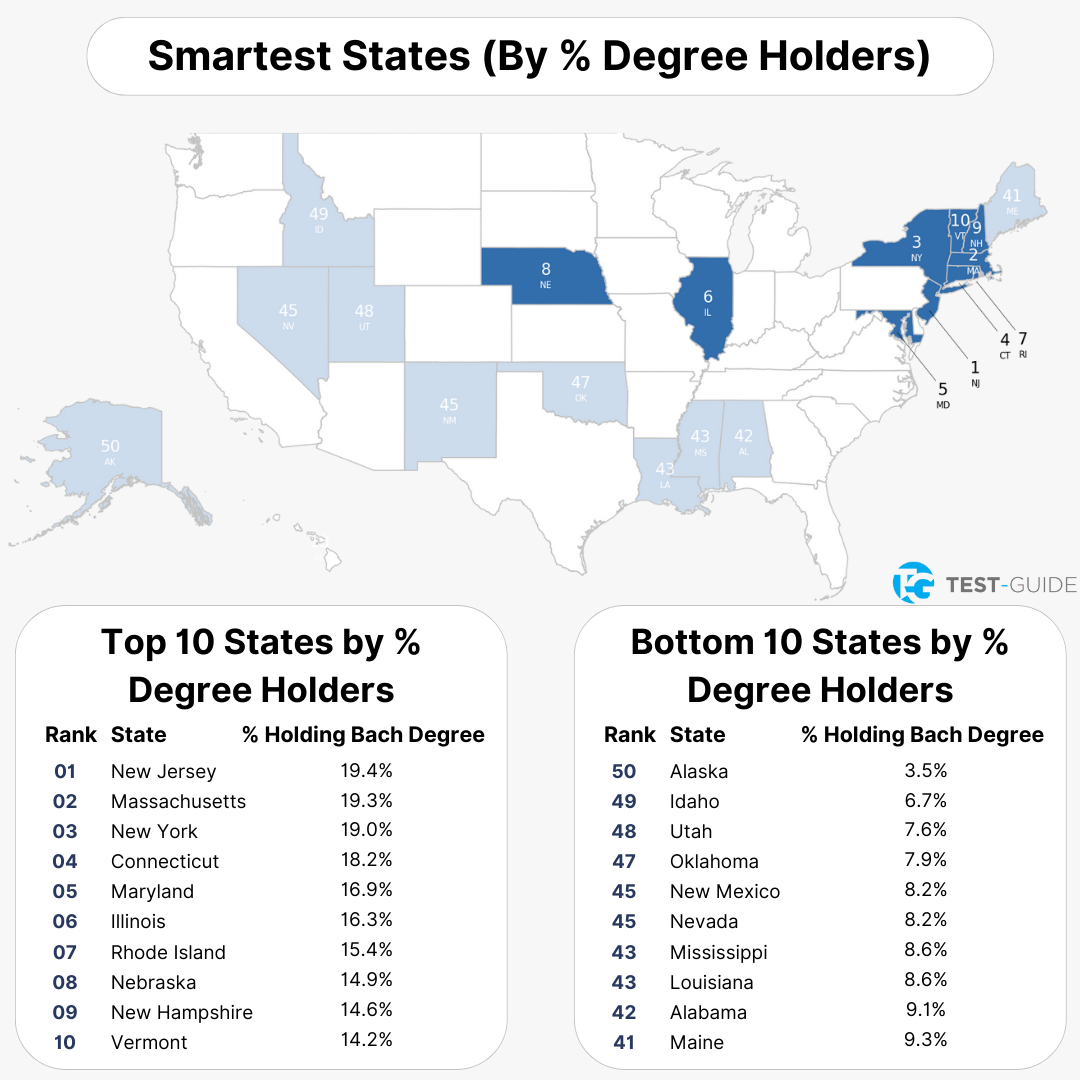
Smartest States by Percent Holding a Bachelor Degree
We used the percentage of individuals who hold a bachelor’s degree as a ranking factor when calculating the smartest states.
Review the top 10 and bottom 10 states in terms of high school graduation rates below.
What Behaviors Correlate to Smart Rankings
We wanted to take our study a step further and see if we could correlate certain behaviors to our “smartness” rankings. We looked at the following categories of behaviors:
- Risky Behaviors
- TV Viewing Behaviors
- Beliefs
- Other Behaviors
Risky Behaviors
We were interested in seeing if there was any relationship between “risky behaviors” and intelligence. In general, risky behaviors are any behaviors that may result in negative consequences for the individual. To explore this, we looked at the following:
- Marijuana Usage
- Gambling
- Drinking
- Smoking
- Prison Time
Here are our interesting findings:
| Risky Behavior | Correlation Coefficient | “In English” |
|---|---|---|
| Marijuana Usage | 0.16 | No Correlation to State Intelligence |
| Gambling | -0.24 | No Correlation to State Intelligence |
| Drinking | 0.32 | Slight Positive Correlation to State Intelligence |
| Smoking | -0.49 | Moderate Negative Correlation to State Intelligence |
| Prison Time | -0.60 | Moderate Negative Correlation to State Intelligence |
Key Takeaways:
Smoking and prison time were found to have a moderate negative relationship with state intelligence – states with a higher prevalence of smokers or more people in jail tend to have a lower ranking for intelligence.
TV Viewing Behaviors
Next, we wanted to investigate whether how much TV you watch, or what type of TV shows you are interested in have any relationship to overall intelligence. To explore this, we looked at the following:
- Overall TV Viewing Time
- “Below Deck”
- “The Bachelor”
- “Love Island”
- “Catfish”
- “Temptation Island”
- “The Real Housewives”
- “90 Day Fiancé”
- “Big Brother”
- “Vanderpump Rules”
- “Only Murders in the Building”
- “PBS News Hour”
- “Ted Lasso”
- “Jeopardy”
- “Downtown Abbey”
- “The X-Files”
- “Stranger Things”
- “House”
Here are our interesting findings:
| TV Behavior | Correlation Coefficient | “In English” |
|---|---|---|
| Overall Viewing Time | -0.56 | Moderate Negative Correlation to State Intelligence |
| Below Deck | 0.58 | Moderate Positive Correlation to State Intelligence |
| The Bachelor | 0.61 | Moderate Positive Correlation to State Intelligence |
| Love Island | 0.40 | Slight Positive Correlation to State Intelligence |
| Catfish | -0.38 | Slight Negative Correlation to State Intelligence |
| Only Murders in the Building | 0.66 | Moderate Positive Correlation to State Intelligence |
| PBS News Hour | 0.56 | Moderate Positive Correlation to State Intelligence |
| Ted Lasso | 0.67 | Moderate Positive Correlation to State Intelligence |
| Jeopardy | 0.43 | Slight Positive Correlation to State Intelligence |
| Downton Abbey | 0.46 | Slight Positive Correlation to State Intelligence |
| The X-Files | 0.31 | Slight Positive Correlation to State Intelligence |
| Stranger Things | -0.32 | Moderate Negative Correlation to State Intelligence |
Key Takeaways:
Five TV series (Only Murders in the Building, PBS Newshour, Ted Lasso, Below Deck and The Bachelor) were found to have a moderate positive relationship with state intelligence – states showing more interest in these TV series tend to have a higher ranking for intelligence.
Overall TV Viewing time was shown to have a moderate negative relationship – states that had high rankings for intelligence tended to watch less TV.
Beliefs
We wanted to see if an individual’s beliefs were related to intelligence rankings. To explore this, we looked at the following:
- Religiosity
- Flat Earth Conspiracy Theory
- New World Order Conspiracy Theory
- Chemtrails Conspiracy Theory
- Moon Landing was Fake Conspiracy Theory
- CIA and JFK Assassination Conspiracy Theory
- % of State that Voted for Biden
Here are our interesting findings:
| Belief | Correlation Coefficient | “In English” |
|---|---|---|
| Religiosity | -0.55 | Moderate Negative Correlation to State Intelligence |
| % of State that Voted for Biden | 0.29 | Slight Positive Correlation to State Intelligence |
Key Takeaways:
Religiosity was shown to have a moderate negative relationship – states that had higher percentage of religious believers tended to have lower intelligence rankings.
Belief in conspiracy theories and voting preferences did not seem to correlate with intelligence.
Other Behaviors
In our attempt to see what may be related to intelligence we looked at a diverse set of behaviors. To explore this, we looked at the following:
- Sports
- Cars/Trucks
- Reading
- Types of Alcohol
- Personal Income
- Personal Debt
- Educational Spending
Here are our interesting findings:
| Other Behaviors | Correlation Coefficient | “In English” |
|---|---|---|
| Golf | 0.57 | Moderate Positive Correlation to State Intelligence |
| Pickup Trucks | -0.37 | Slight Negative Correlation to State Intelligence |
| Reading Interest | 0.65 | Moderate Positive Correlation to State Intelligence |
| Personal Income | 0.62 | Moderate Positive Correlation to State Intelligence |
| Personal Debt (Non-Mortgage) | -0.34 | Slight Negative Correlation to State Intelligence |
| State’s Education Expenditure / Student | 0.58 | Moderate Positive Correlation to State Intelligence |
Key Takeaways:
Interest in golf had a moderately strong positive correlation – states that displayed a higher interest in golf tended to have higher intelligence rankings.
Reading interest showed a moderately strong positive correlation – states with more active readers tend to have higher intelligence rankings.
Personal income also was moderately correlated with intelligence – states with higher intelligence rankings seemed to have higher personal incomes.
The amount of money a state spends per student on education had a moderate positive correlation – states that spent more per student tended to have higher intelligence rankings.
Key Findings and Conclusions
So, what does all of this mean? Review our key findings and conclusions below.
Vermont is Smart
Vermont was our top ranked state for intelligence. Although Vermont didn’t rank #1 for any of the four individual factors, they were in the top 10 for all of them. Not surprisingly, Vermont also had very strong rankings for educational expenditures per student and reading interest.
In the “draw your own conclusions” category, Vermont ranked #1 for marijuana usage and % of voters supporting Biden. Vermont was also ranked #49 for gambling.
Vermonters don’t watch much TV, but when they do, they seem to enjoy Jeopardy! and PBS NewsHour.
Key Takeaways:
Vermont is the smartest state in the US. They did not rank #1 for any of the four individual factors we looked at, but were top 10 for all of them.
- IQ Rank: 4
- Exam Scores: 6
- HS Graduation Rate: 3
- Degree Rank: 10
Other Interesting Facts / Rankings:
- Marijuana Usage: 1
- Gambling: 49
- % Biden: 1
- Education Dollars /Student: 2
- TV Viewing Time: 42
- Jeopardy!, PBS NewsHour Interest: 1
- Library Books and Visits Per Capita: 1
- Ranked Bottom 4 for Interest in Each Conspiracy Theory
Mississippi Ranks Low in All Categories, 50th Overall
Mississippi ranks 48th in IQ, 49th in standardized exam scores, 48th in high school graduation rank and 43rd in percent holding a bachelor’s degree – all resulting in making Mississippi the lowest state ranked by intelligence.
They are interested in pickup trucks, but not golf. They have the nation’s lowest income but rank #5 for personal debt. They are not interested in reading and go to the library less than any other state. They are very religious, don’t use Marijuana much, but do like to gamble. There are more Mississippians in prison than every other state except Alaska.
In 2018, Mississippi’s State Board of Education created a 5-year strategic plan known as “Mississippi Succeeds Plan”. It included plans and measurement metrics to increase student growth and proficiency in multiple areas. Although Mississippi still has significant work to do, it did lead the nation in gains in 4th grade reading and math – a strong indicator of intelligence.
Key Takeaways:
Mississippi has some work to do in their quest to become the smartest state. They ranked low in all factors we looked at.
- IQ Rank: 48
- Exam Scores: 49
- HS Graduation Rate: 48
- Degree Rank: 43
Other Interesting Facts / Rankings:
- Marijuana Usage: 40
- Gambling: 4
- Prison: 2
- Religiosity: 1
- Education Dollars/Student: 45
- Reading Interest: 45
- Library Visits Per Capita: 50
- Golf: 45
- Pickup Trucks: 1
- Income: 50
- Personal Debt: 5
You Can’t Judge A …
In this case, you can’t judge how smart someone is by their TV habits. Although the amount of time people watch TV seems to be inversely correlated with intelligence, there appears to be no sense to be made from what they watch.
States that watch more TV seem to have a lower intelligence ranking. The bottom 10 intelligent states watched an average of 3.12 hours of TV per day while the top 10 states only watched 2.65 hours per day – a full 27% lower. Once again the relationship is not absolute. For example, New Mexico residents only watched 2.3 hours per day (47th in nation) but were also ranked 48th for intelligence.
Trying to correlate TV series with intelligence rankings proved to be an interesting endeavor. We looked at state by state interest in a diverse set of TV shows. We included TV series that are typically thought of as “trashy” or “guilty pleasures” as well as series that many consider “witty” or “thought provoking”.
Ten series had no correlation with state intelligence rankings – implying no relationship between interest in these shows and intelligence. No series that we evaluated had an inverse correlation – which would’ve have implied that residents in less intelligent states would be watching them more. Seven series had moderately positive correlations which means that higher ranked intelligent states tended to have more interest in them – this included both “trashy” and “witty” TV shows.
Key Takeaways
TV Shows with Positive Correlations to Intelligence:
- Below Deck
- The Bachelor
- Downton Abby
- Only Murders in the Building
- PBS Newshour
- Ted Lasso
- Mashups
TV Shows with No Correlation to Intelligence:
- Temptation Island
- Love Island
- The Real Housewives
- 90 Day Fiance
- Big Brother
- Catfish: The TV show
- Vanderpump Rules
- Jeopardy!
- X-files
- Stranger Things
Those Who Value Education and Learning Tend to Be More Intelligent
As Albert Einstein famously said: “I have no special talents. I am only passionately curious.” We found that states that value education and learning seem to have higher intelligence rankings.
States that spend more on student education tend to have a higher intelligence ranking. The top 10 intelligent states spent an average of $20,500 per student while the bottom 10 states spent an average of $13,500 per student – a remarkable difference of 52%.
The correlation, however, is not perfect. For example, New York led the nation in educational spending per capita ($30,200), yet ranked 29th for intelligence. Similarly, Virginia ranked 28th for educational spending yet ranked 5th for intelligence.
Similarly, states whose residents are more interested in reading seem to be more intelligent. Evaluating library statistics, the top 10 states by intelligence displayed library activity (books, visits, and circulation per capita) greater than the bottom 10 states by between 46% and 74%.
Key Takeaways
- States that spend more on student education tend to have a higher intelligence ranking.
- States whose residents are more interested in reading tend to be more intelligent.
Some Expected Results but Some Surprises
We looked at a broad spectrum of behaviors to see which ones might be correlated with intelligence rankings. Some correlations were expected (seemed likely) while some behaviors that we thought would be correlated were not.
In the risky behaviors category, we were surprised that Marijuana usage and Gambling showed no correlation while smoking did. Perhaps it is more widely believed that smoking has more potentially bad consequences than either marijuana usage or gambling resulting in a stronger correlation.
The prison population (per capita) had a moderately strong correlation with state intelligence rankings. This is an expected result if you consider that lower intelligence might be related to making poor decisions (that break the law) or getting caught.
When we looked at an individual’s general beliefs, we also found surprising results. We would’ve expected that beliefs in easily disproved conspiracy theories would have been inversely correlated with intelligence – implying less intelligent states would believe these theories more often. This was not the case – we found no correlations. One possible explanation is that we evaluated “interest” in these conspiracy theories (as measured by search volume via Google Trends) which may differ from “belief” in these theories (e.g., people may be just searching about them to see what they are all about).
When we decided to look at other beliefs (religion and voting preferences), we did not know what to expect. Religiosity had a moderately inverse relationship (implying lower ranked states were more religious). There was no correlation between the percent of a state that voted for Biden and intelligence rankings (likewise for voting for Trump). We expect that because both of these topics (religion and politics) are “unfit for polite conversation” that there would not be any popular consensus whether either of these would be correlated with intelligence.
Key Takeaways
- Marijuana usage and Gambling showed no correlation to intelligence.
- Smoking showed a negative correlation to intelligence – states with a higher prevalence of smokers tended to have lower rankings for intelligence.
- Prison showed a negative correlation to intelligence – states with a higher prison population tended to have lower rankings for intelligence.
- There were no significant correlations with intelligence and conspiracy theories.
- Religiosity had a moderate negative correlation to intelligence – states that were more religious tended to be less intelligent.
- No significant correlation between voting for Biden / Trump and intelligence.
Methodology and Data Sources
We used a variety of data sources to develop our rankings and analysis. Review our sources and methodology below.
Smart Rankings
We assessed four metrics and developed our state smartness rankings based on the weights in the table below:
| Metric | Notes | Source |
|---|---|---|
| IQ | Estimated Based on State PIAAC and NAEP exams | Source for IQ |
| Standardized Exam Scores | Combined ACT and SAT Scores | ACT Scores Source SAT Scores Source |
| High School Graduation Rates | Public HS 4-year Cohort Graduation Rate | Graduation Rates Source |
| % of Bachelor’s Degree | 18-24 Year Olds | Bachelor’s Degree Percentage Source |
Risky Behaviors
| Behavior | Notes | Source |
|---|---|---|
| Marijuana Usage | Usage 18+ Years Old | Marijuana Usage Source |
| Gambling | Based on State’s Gambling Friendliness & Problem/Treatment | Gambling Source |
| Drinking | Gallons of Ethanol Per Capita | Drinking Source |
| Smoking | Currently Smoking Per Capita | Smoking Source |
| Prison Time | Prisoner Population Per Capita | Prison Time Source |
TV Viewing Behavior
| Behavior | Notes | Source |
|---|---|---|
| TV Viewing | Hours Per Day Estimate | TV Viewing Source |
| TV Series | Search Volume | TV Series Source |
Beliefs
| Behavior | Notes | Source |
|---|---|---|
| Religiosity | Adults Who are “Highly Religious” | Religiosity Source |
| Conspiracy Theories | Search Volume | Conspiracy Theories Source |
| Voting Preferences | % Voted Biden, 2020 Election | Voting Preferences Source |
Other Behaviors
| Behavior(s) | Notes | Source |
|---|---|---|
| Sports, Vehicles | Search Volume | Sports, Vehicles Source |
| Reading Interest | Library Books Per Capita, Circulation Per Capita, Library Visits, Interest in Kindle | Reading Interest Source (NCES) Reading Interest Source (Google Trends) |
| Personal Income | Median Household Income | Personal Income Source |
| Personal Debt | Average Non-Mortgage Debt | Personal Debt Source |
| Educational Spending | $ / Student | Educational Spending Source |

- Authored By: Dave Evangelisti
- Last Updated October 3, 2023